Traffic visualization platform
Traffic visualization platform
Introduction
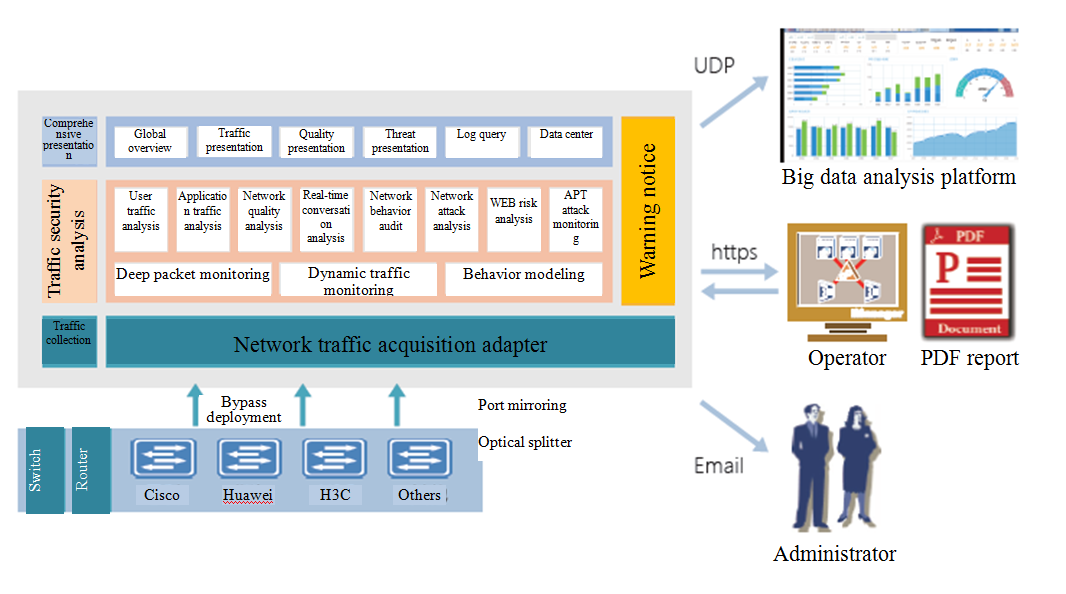
ABT traffic security visualization platform is a high-performance network traffic data acquisition and security intelligent analysis hardware platform based on big data and visualization technology. Through the distributed deployment in the key nodes of enterprise network, it can conduct multi-dimensional and deep level application protocol identification and content analysis through the node mirror traffic, ultimatelypresent the overall network operation, network quality, service quality, network access behaviors, etc.in rich graphical forms combined with intelligent analysis of big data, and assist the enterprises to actively identify potential unknown network threats combined with security threat analysis models and abnormal alarms, so as to achieve visualized network traffic, known behaviors and controllable threats for enterprises.
Schematic diagram of architecture

Functions & features
Network traffic collection
√ The platform, using the bypass deployment mode, collects the network traffic data through the switch port mirroring mode without changing the enterprise original network architecture;
√ It can support the configuration of virtual link interface based on VLAN, VxLAN ID, MPLS TAG and network segment, and realizes the flexible collection of cloud data center, SDN network and shunt exchange convergence traffic.
√ It can provide capture of link traffic real-time data packet and backtrack historical data, and can customize the capture conditions and parameters.
Application protocol analysis
√ The platform, using DPI (deep packet inspection) deep packet detection technology for the application layer protocolanalysis, can identify more than 1,500 kinds of pre-defined applications and 500 kinds of custom applications accurately and efficiently and make full analysis of the composition, performance and traffic rate of network traffic.
√ It can identify and resolve the specific internal service applications for HTTP, FTP, MYSQL, MAIL and OA and assist the big data analysis platform to establish the normal access benchmark model between the user and the service, so as to provide strong data support for abnormal access of users and detection of abnormal user access.
Traffic panorama presentation
√ The platform can realize the OSI 7-layer traffic monitoring analysis of the network traffic, and can display the receiving and sending of full duplex mode and all traffic and data packet information.
√ It provides the presentation of analysis contents of the host, protocol and conversation, and supports the association analysis, intelligent sorting, fuzzy query and multi-level extraction;
√ For users, service applications and server objects, it can present statistical analysis results of historical data, and can also provide real-time traffic, conversation information and conditional search, allowing users to understand the network traffic and service status at a glance.
Network quality presentation
√ It can carry outreal-time analysis and trend forecasting for network traffic rate, time delay and abnormality, and provide data support for fault location, link upgrade, bandwidth planning and policy adjustment.
√ It can support monitoring and presentation of network abnormalities, including the abnormal link of network layer and application layer, and presentation of statistical analysis results of abnormal conversation; it also supports network response.
√ It can monitor and present the time delay and application response delay, and help determine whether the user experience delay deviation is due to network impact or application.
Network behavior analysis
√ It can carry out image analysis and data association analysis for multiple user behaviors, such as the internal users’ access to internal resources and external resources and external users’ access to internal resources, so as to accurately identify the abnormal user access and abnormal access of user;
√ It can carry out fine-grained log audit for various user access resources and behaviors, and make comparison based on the log information and the user's normal access benchmark, so as to realize user access compliance analysis and security trend analysis.
Security threat analysis
√ Through the abnormal detection of traffic data, it can rapidly detect network attacks, worms, Trojans, abnormal links, sensitive data outgoing, illegal operations and other abnormal behavior that is hazardous to the network security;
√ It can quickly find high-level targeted attack behavior and accurately access to attack traces and evidence, so as to prevent further spread and penetration in a timely manner.
Abnormal alarm notification
√ It can actively identify potential unknown network threats through the threat perception model and the "traffic baseline" detection mechanism to help users build sensitive network threat perception capability;
√
It can support traffic monitoring, eigenvalue matching, suspicious domain name, abnormal behavior and other types of abnormal alarms;
√ It can support monitoring page prompts, e-mail notification, interface output and other alarm modes.
Intelligent report analysis
√ The data analysis platform collects and stores the traffic data information collected by the traffic security visualization platform, and provides rich and powerful report analysis function based on big data analysis technology;
√ The data analysis platform can provide daily, weekly, monthly, quarterly and annual report for short, medium and long-term network operation and security operation and support custom report of users.
Typical applications


